Previous animations simulated collisions at a center of mass energy of 200 GeV per nucleon. This is the maximum energy at the Relativistic Heavy Ion Collider (RHIC) at Brookhaven National Laboratory. RHIC can also run at many lower beam energies, which provide additional import information about the QCD phase diagram. The following animations show collisions at several beam energies below 200 GeV. Heavy ion collisions at 2 GeV per nucleon beam energy are carried out at GSI in Darmstadt, Germany and the intermediate energy range is going to be explored with FAIR in the future.
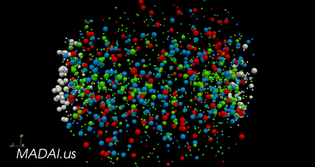
The following animations simulate central (b = 2 fm) Au+Au/Pb+Pb collisions at 2 and 40 GeV per nucleon beam energy. Each sphere represents a particle with the radius scaled by the square root of the mass. Different colors indicate the various particle types, as described by the legend. Notice that the fireball is much larger and there are many more strange particles at the higher beam energy.
This visualization shows the same collisions, but colors the particles differently. White particles are the original gold nucleons, while red/green/blue particles are created in the collision. The colors indicate the magnitude of the transverse momentum: p_T < 0.4 (green), 0.4 < p_T < 0.8 (blue), p_T > 0.8 (red).
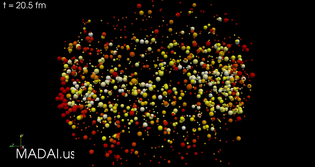
Here, particles are colored by their last interaction time. Particles turn white when they interact, then begin fading to red over time.
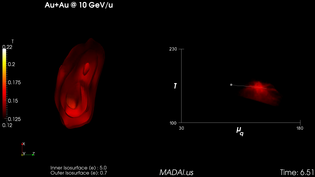
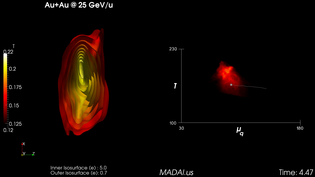
These animations show the time evolution the quark-gluon plasma. On the left are temperature isosurfaces (three-dimensional surfaces over which the temperature is constant); on the right is a temperature-chemical potential phase diagram. Downloads are available for beam energies 10, 25 and 40 GeV.
All these animations have been created using output from a single heavy ion collision simulated with the Ultra relativistic Quantum Molecular Dynamics (UrQMD) approach. The OSCAR output for particle data and for hydrodynamic evolution has been converted to xmf/h5 output with the converter program developed for this purpose. The MADAI workbench based on paraview software has been used to generate state-of-the-art 3d visualizations. Read more about the scientific context for these visualizations here.


